Hi, I'm Paul Reed - a 32 year old living in the city of Norwich. I have a keen interest in programming, gaining a first class
degree in computer science from the UEA in 2012. I worked for a national civil engineering firm for 13 years and tried
to put my knowledge of programming to good use in that role when I could. I now work for Autodesk, helping their customers get the best out of their products.
I spend a lot of my spare time writing code for my personal projects. With this website I hope to demonstrate some of my work.
// Programming
OSGB36 Easting and Northings - ETRS89 Latitude Longitude Conversion
I had thought that the script I created previously to convert ETRS89 latitude and longitude to OSGB36 eastings and northings would
be sufficient for my purposes. I wanted latlng -> east/north primarily because I was building a mapping app which would allow
a user to draw on it and thus generate a list of eastings and northings for import in AutoCAD Civil 3D - the idea being the user could draw tram lines etc. within a city, in the browser, using Open Street Map as a background layer; then if they wanted they could import this into C3D as polylines.
The problem came about when I wanted to incorporate some data from Ordnance Survey for postcode regions. These regions are
defined as a polyline, but these polylines are specified as OSGB36 eastings and northings, this is a problem for
my mapping app as it uses Leaflet which in turn uses ETRS89 lat lngs! So I needed a script to convert back again,
from OSGB36 eastings and northings back into ETRS89 latitude / longitude.
This was a little more involved than the previous script - it requires a couple of iterations to get back to ETRS89 latitude and
longitude from OSGB36 eastings and northings.
Firstly, we need to reverse the OSTN15 shift. We do this by passing in the OSGB36 eastings and northings to get our first
guess of what shift was applied to the ETRS89 eastings and northings. With this new adjusted value we try again to
find the shift, improving each time until we're satisfied we're as close as we're going to get - we know we're at
this point when the difference between the previous shift and the new shift is less than 0.0001m in both the eastings
and northings. With the correct shifts identified, we can reverse these. Simply subtract the shift from the OSGB36
eastings and northings to get the ETRS89 eastings and northings.
OSGB36 Easting
484228.591
OSGB36 Northing
155542.948
Iteration
Easting Shift
Northing Shift
1
97.6817754548
-78.8695975497
2
97.6793378976
-78.8727917185
3
97.6793377760
-78.8727917606
ETRS89 Easting
484130.912
ETRS89 Northing
155621.821
We now have the ETRS89 eastings and northings. Next, we need to convert these to latitude and longitude. Again, this
is an iterative procedure. Firstly, we need the ellipsoid constants we used when converting ETRS89 to OSGB36; and the projection constants, the projection we're using is the National Grid projection:
Ellipsoid Constants
Semi-major axis
a
6,378,137.0000m
Semi-minor axis
b
6,356,752.3141m
Eccentricity squared
e^2
0.00669438003551
Projection Constants
Scale factor on central meridian
F0
0.9996012717
True origin, latitude: 49 degrees N
lat0
0.855211333477 (radians)
True origin, longitude; 2 degrees W
lon0
-0.0349065850399 (radians)
Map coordinates of true origin
E0
400,000m
Map coordinates of true origin
N0
-100,000m
n
0.0016792203978
Now we can begin the second iterative procedure. We begin by calculating lat' and M.
lat'
0.8953051391
M
255420.6896490931
Then we check to see if the absolute value of
(N - N0 - M) => 0.01mm. If it is, we obtain a new value for lat', again recomputing M. We keep doing this until
we have the final lat' which satisfies the above constraint.
lat'
0.8953367047
Now the iterative calculations are done, it's just a case of converting the ETRS89 easting and northings to latitude and longitude. Again,
this is a fairly lengthy process so I've just copied in the results of each stage below. For the actual calculations
see the code on my GitHub page.
p
6371842.800815761
v
6388631.164616689
n2
0.0026347737
VII
1.5330891453e-14
VIII
3.0173150202e-28
IX
7.9358993746e-42
X
2.5034231282e-07
XI
4.2101765047e-21
XII
1.3383844198e-34
XIIA
5.1274240608e-48
ETRS89 lat
51.292798
ETRS89 lng
-0.793407
ETRS89 Latitude Longitude - OSGB36 Easting and Northings Conversion
I like to build a lot of mapping applications in my spare time, but I have a problem. Most data I use to populate my maps
comes in OSGB36 eastings and northings not ETRS89 latitude and longitude which a lot of mapping packages such as
Leaflet expect. I initally thought this wouldnt be a big problem, I could just use online converters such as
gridreferencefinder.com - but as I started to use this I noticed some discrepancies between what
gridreferencefinder.com would give me compared to other services. So I spent a bit of time looking into this
and found the process was a little more challenging than I first thought!
Firstly, the coordinates we start off with (in ETRS89) are in the latitude, longitude format. For us to process them we need
them to be in the easting / northing format. It's worth noting here, this is NOT Ordnance Survey eastings and northings,
it's ETRS89 eastings and northings. To convert to ETRS89 eastings and northings we have to perform a number of calculations...
We start by gathering the constants we'll need. These are helpfully provided to us by Ordnance Survey. The first group we
need are the Ellipsoid constants, and for this conversion we need to use the constants for the GRS80 ellipsoid (aka
WGS84 ellipsoid). For the second group we need the projection constants, and for this, the projection we're using is National Grid.
Ellipsoid Constants
Semi-major axis
a
6,378,137.0000m
Semi-minor axis
b
6,356,752.3141m
Eccentricity squared
e^2
0.00669438003551
Projection Constants
Scale factor on central meridian
F0
0.9996012717
True origin, latitude: 49 degrees N
lat0
0.855211333477 (radians)
True origin, longitude; 2 degrees W
lon0
-0.0349065850399 (radians)
Map coordinates of true origin
E0
400,000m
Map coordinates of true origin
N0
-100,000m
n
0.0016792203978
With these constants in place we can then perform the steps required to convert the ETRS89 latitude and longitude to ETRS89 eastings and northings. The calculations to do this, whilst quite simple are quite long, and there are a lot of steps involved so I haven't
included them here but the code can be seen on my GitHub page where I have provided the python scripts. But you can
see the results of these intermediate steps I got for the following test coordinate:
ETRS89 latitude
51°17'34.1"N = 51.292798 decimal
ETRS89 longitude
0°47'36.3"W = -0.793407 decimal
n
0.0016792204
v
6388628.89105
p
6371835.99805
n2
0.0026354873
M
254930.494959
I
154930.494959
II
1558780.04496
III
176087.823628
IIIA
-17807.1222654
IV
3995069.98486
V
-144399.994599
VI
-105925.175643
ETRS89 Northing
155621.821024
ETRS89 Easting
484130.912002
We now have the ETRS89 eastings and northings. The next step is convert these to OSGB36 eastings and northings. This is done
using OSTN15 provided by Ordnance Survey. This lists a number of adjustments for each point in the UK spaced on a
1km grid. To use this we need to find out which cell we're in. Once we've done that we find the adjustments in OSTN15
for each of the four corners of that cell. We then have interpolate these to where we are in the cell giving us an
overall adjustment to apply to our ETRS89 eastings and northings to convert them to OSGB36 eastings and northings.
e_idx
484
n_idx
155
x0
484000
y0
155000
r_nums[0], e_shift[0], n_shift[0]
(109140, 97.701, -78.855)
r_nums[1], e_shift[1], n_shift[1]
(109141, 97.702, -78.87)
r_nums[2], e_shift[2], n_shift[2]
(109842, 97.66, -78.852)
r_nums[3], e_shift[3], n_shift[3]
(109841, 97.667, -78.887)
dx
130.912001572
dy
621.821023583
t
0.130912001572
u
0.621821023583
se
97.6793377665
sn
-78.872791761
OSGB36 Easting
484228.591
OSGB36 Northing
155542.948
Note: I've only calulated eastings and northing coordinates and not elevation as it's not useful for my apps - it should
however, be trivial to add this capability.
Python QR Codes
Quick Response (QR) codes have intrigued me for a while, it's interesting how they encode data in a seemingly random array
of black and white squares; so I decided to try and learn a bit more about them.
I started by taking a look at the original ISO standard for QR codes, I managed to find a version online for free (presumably
as it was superseded by a much more recent version). I also took a look at the Wikipedia article and a few other
websites to get a better understanding of how they work. It turns out they actually aren't that complicated; at
least to make a small one that only supports numbers and alphanumeric data.
First things first is we test the string we want to encode, is it composed entirely of numbers, or a mixture of letters and
numbers, does it contain any characters which aren't supported by the alphanumeric code? We then do a bit more
analysis; what is the length of the message, and does this fit within the limits?
Next we break this message consisting of binary into 8 bit codewords and use these to generate a message polynomial, we then
perform polynomial division with this and a generator polynomial which is specified within the ISO. This leaves
a remainder, this remainder then forms the error codewords. These error codewords are then appended to the message
codewords.
Finally(ish) we place the binary string so far into the QR code, adding the format information and position markers. Before
we can say it's finished we just need to run some masking on the code. With the masking we have varying masks we
can apply to the code - we score each of these and the one with the lowest score is the mask we use. This mask
is applied to the finished code and a references to the mask we used is added to the format information.
This format information is duplicated twice within the QR code to cover for any loss of data, such as if the code was covered
with dirt, or part of the code was missing.
The code for this is available on my GitHub page using the link below.
Python Cross Stitch Patterns
Having seen a few simple cross stitch patterns I thought it would be interesting to produce a script which can convert colour
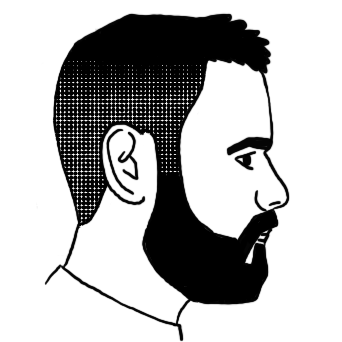
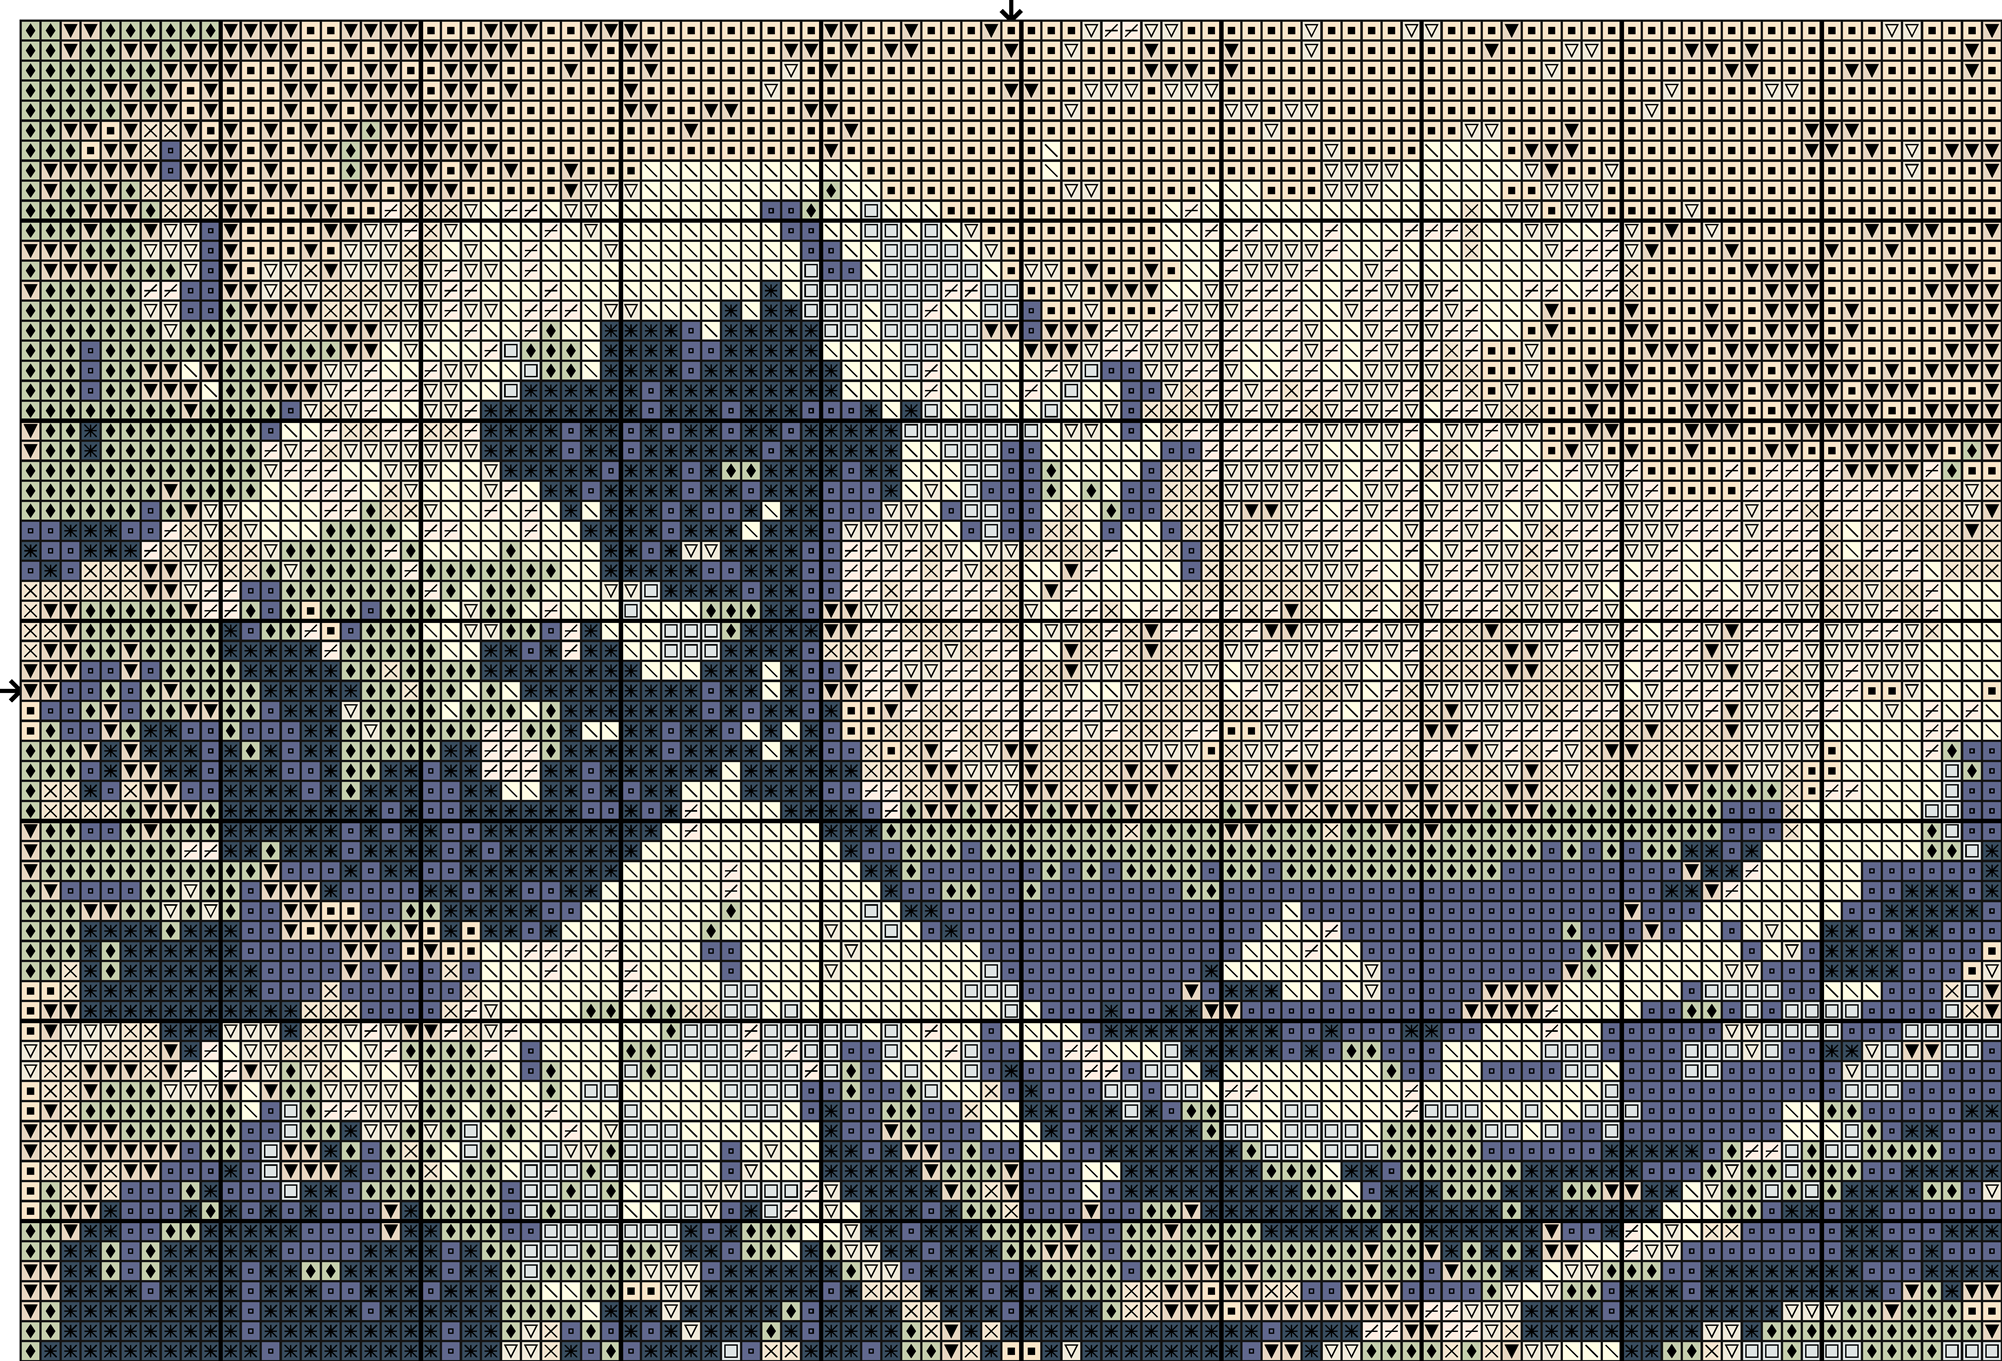
photos into cross stitch patterns. I got inspiration for this after seeing a cross stitch kit for Hiroshige's the
'The Great Wave off Kanagawa' for £50 and thought I could produce a script to do a similar thing.
I started by reading a photo into Python then reducing the number of colours in the image - a process called quantisation.
The user can set the number of colours they wish to use, by default it's set to ten colours. Next I pass through
the image and remove any extraneous 'pixels' - it can be a pain to cross stitch a single stitch in isolation so the
script checks to see if it has at least one other stitch of the same colour nearby.
Next, the colours are compared to a set list of available DMC colours, trying to find the closest visual match. The closest
match is recorded and added to a table of selected colours - along with the associated information such as the RGB
values, the DMC number and name.
Finally I produce a number of SVG pattern outputs:
Black and white with symbols
Colour with symbols
Colour without symbols
And finally a key
Next steps? I could adjust the script to take into account the Aida count of the fabric used and then indicate what length
of each colour is required.
Raspberry PI Robotics
I've had a Raspberry Pi for a while but it's only recently I decided to really get into using it to its full potential. I
had tried out making stuff with breadboards and LEDs etc. and linking with the Twitter API to light up LEDs when
a certain search term was mentioned.
Since then I've been exploring a bit more about how it can work with sensors and used to control motors etc. Using a cheap
robot chassis kit and a lot of wire, veloboard, sensors and soldering I managed to make a robot which could navigate
a room; successfully avoiding walls and objects.
Currently it has a small LED screen which displays the robot's IP address (allowing wireless connections) and ultrasonic
sensors to aid autonomous movement. I've added a camera on a three axis moveable bracket, powered by servos, allowing
a full field of view.
Next steps? I also have a few Raspberry PI zeros; I'd like to create something with these. First thoughts are to combine
one of these with a small red, black and white e-ink display and portable battery pack to create a mobile sensor
of some sort - perhaps a GPS logger of some sort. I've an interest in mapping and it might be cool to see my movement
throughout the day on a map.
On another one I may place a sensor of some sort and embed a sim card to transfer sensor information across the web to
display on a dashboard.
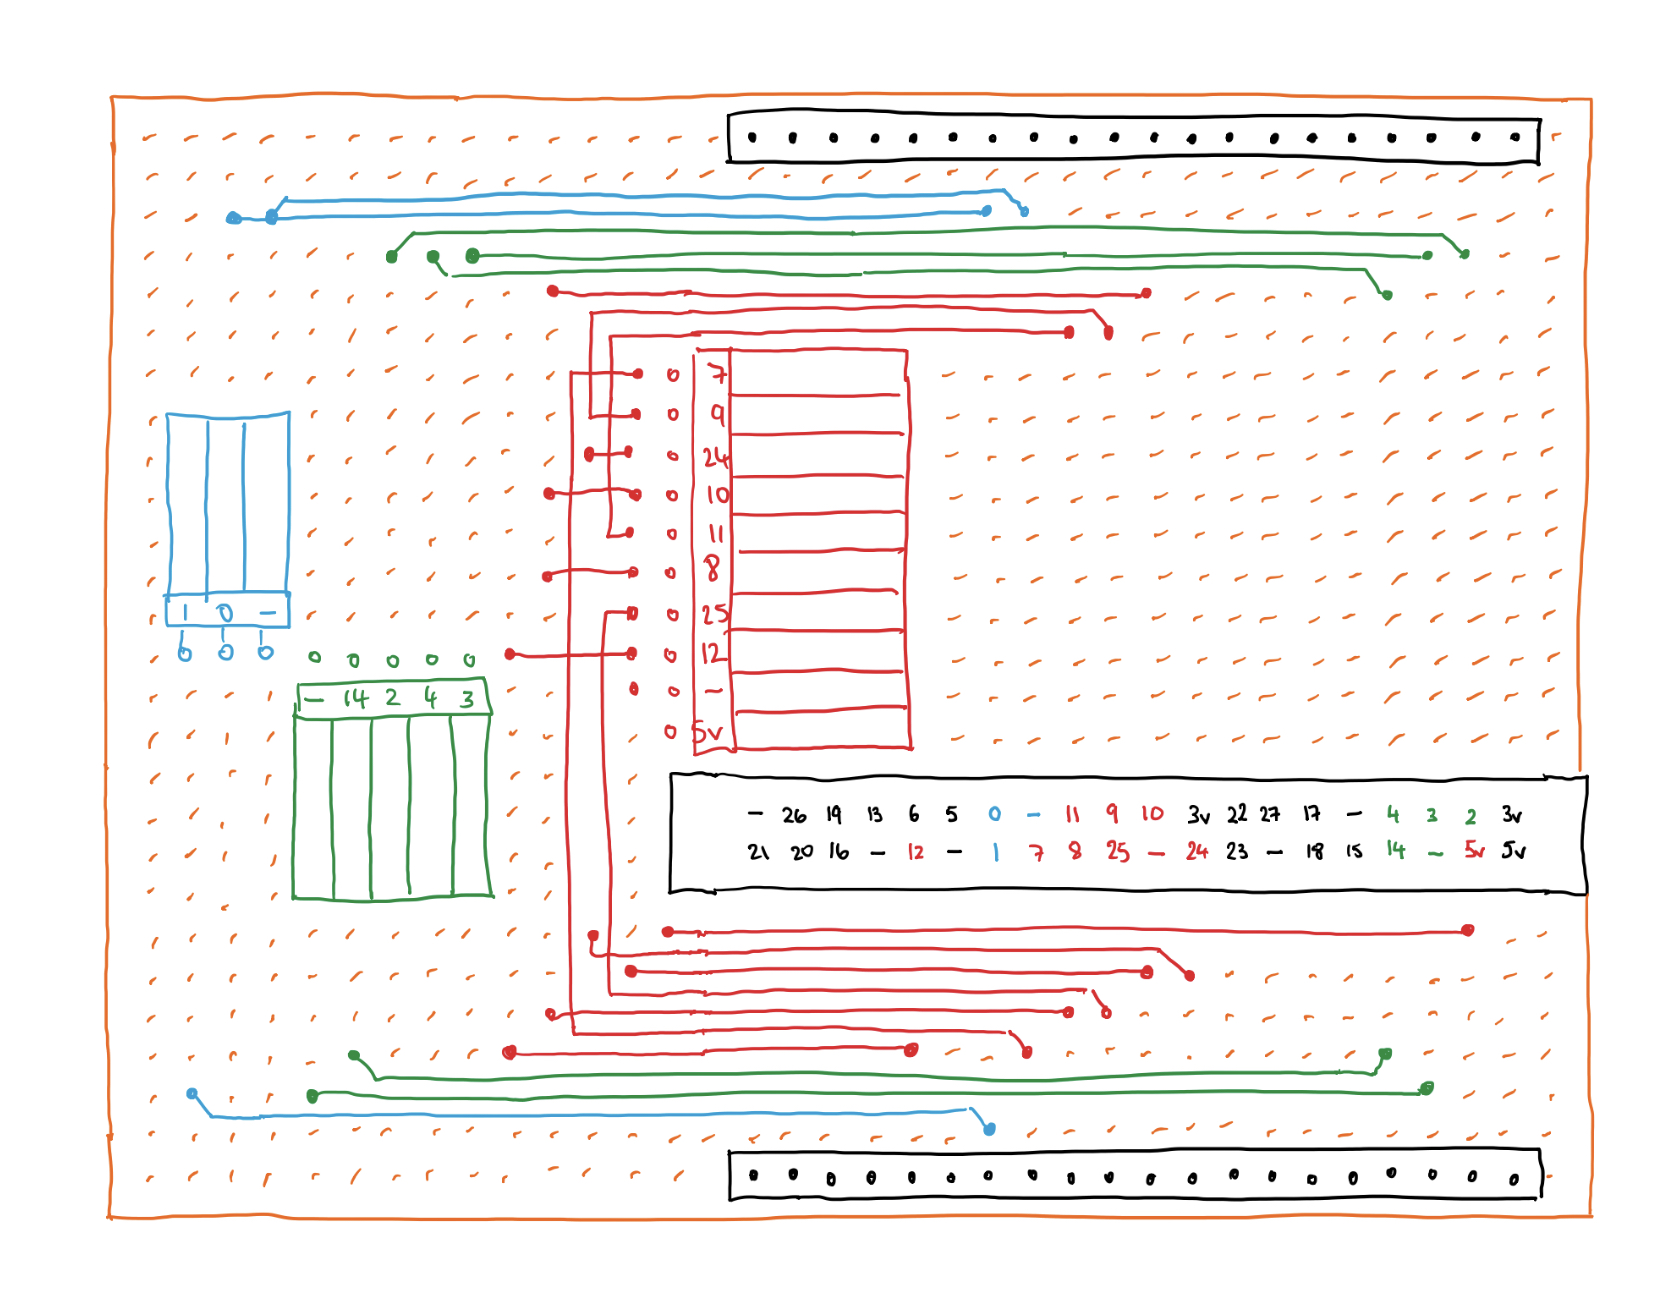
Wiring Diagram:
Sketch of a circuit board I made to connect various components to the Raspberry Pi easily.
Virtual Reality
I started with virtual reality when I realised it could be done relatively inexpensively using your mobile phone and a Google
Cardboard VR headset. For this we require a certain type of image, a 360 degree 'equirectangular' image. I work in construction
and one of our software packages (Revit) has the option to export 360 degree images as a cube map in which your view
is represented with 6 separate images (actually one, but six separate sides of a box are contained in this one image).
To get these Revit renders into a equirectangular format I could have used any number of online convertors but I was interested
to learn how these weird, warped images are made and so I set about learning about the equirectangular format. Once
I had a good understanding of this I wrote a number of Python scripts to convert these cube map images into equirectangular
images.
To go along with these scripts I also wrote an iPhone application to show these equirectangular images - and embedded the
conversion code within the app so it could work with Revit cube map exports. It was pretty cool seeing inside your
Revit projects.
With my interest growing I purchased a 360 degree camera (a Samsung Gear 360, version 2) and noticed that it used a new format,
a dual fish eye. This format consists of two circular images side by side, one for each of the Gears two cameras.
The camera came with software to convert these images into equirectangular but again I was interested to learn how
it was done so I set about learning and producing a conversion script in Python.
Next steps? I'd like to take a look at how VR can be incorporated into a website, nothing fancy, just a viewer for equirectangular
images basically. Most 360 cameras record the GPS coordinates and so it could be interesting to map these using a
custom built web app.
You can find out more about the conversion process using the link below.
Voronoi Generation
I started this as an introduction to procedural generation of terrain. Procedural generation of landscapes os something I'd
been interested in for a while but thought it might be a bit difficult to get some good results. However, I stumbled
upon an article for generating terrain using a combination of a voronoi diagram and simplex noise.
First we needed some triangles to manipulate; we could do something just based on generic repeatable triangles but I decided
I'd prefer something which looks a little more random, more natural to some extents. This is where the voronoi diagram
came in, with this we can place a load of random points on a plane. I can then produce a voronoi diagram using these
points. With can then split each polygon into a number of triangles, I do this by finding the centre of the polygon
and then drawing lines out from each of these to produce the triangles.
Next, I generate a square of 2D simplex noise, and combine this with a circular fall off function meaning there are is no
noise towards the edge of the square and we're guaranteed to have the island contained within the square. I then
used this noise map to generate the heights of the the triangle vertices in the voronoi diagram. For each x,y coordinate
in the list of triangle vertices we find the corresponding pixel in the noise map. The noise map will either be fully
black for 'zero' height, or fully white for 'full' height, or somewhere in between. We can multiply this by a maximum
island elevation to get the elevation for each point.
With an x, y and z coordinate for each of the points in the triangles we can now get onto rendering. We just need one more
bit of information, the colour to use. For this I so a simple colour based on the elevation of each of the points.
If the elevation is zero, it is recorded as sea, and as it increases in elevation it gradually changes colour from
turquoise to a sandy colour to light green, green, grey then white.
Next steps? I'm not working on this anymore, choosing to focus more on a procedurally generated planet rather than a single
island. If I were, I would have looked into using a biome system somehow. Combining moisture, temperature and elevation
maps to style the island better. For example high up, in a wet environment we might have snow, in a wet tropical
environment we may have a deep green rainforest.
Procedural Globe
This is an unfinished project in which I'm trying to generate a planet procedurally. It's something I've been interested
in for a while - I'm not particularly creative and having something which looks quite nice, that didn't require creative
input from myself (other than the programming) is quite appealing. Initially when I thought about procedurally creating
landscapes I focused on creating procedural islands as I thought this would be easier - and it is, there are fewer
polys and the geometry is less complex to deal with.
I then took a step back after producing an app which produced relatively nice islands, it still had a problem - the islands
were all the same shape as they had to fit within the same defined area, they all took on a circular shape as they
have to fit within a square plane. And so I took a look again at producing procedural landmasses on a globe, this
would mean we could produce much more interesting landmass shapes.
Now, obviously - we cannot use a sphere directly, everything in graphics relys on triangles so I looked at trying to find
the best way to represent a sphere using triangles and I decided upon a subdivided icosahedron. This starts out as
a shape with 20, equilateral triangle faces. I then subdivided each of these faces into a further four faces each
and repeat this process until I have reached a set depth of recursion. Whilst doing this I also project out the points
onto a unit sphere so gradually we get a spherical shape. The more subdivision we do, the more spherical the planet
looks - but of course this comes with a performance hit. I ended up setting on subdividing all triangles to a depth
of four; although five still worked quite well.
I then find all the neighbours of each triangle, this is then used to convert the triangles into hexagons and 12 pentagons
- with both of these being termed as 'cells'
With the neighbours all found we can then 'seed' a set amount of continents on random cells, so in my case I seed 10 continents.
I then loop through extending the continents out from the seed points until no more unassigned cells exist. With
this I then convert a number of these continents into water, so out of 10 continents I set seven as water, and the
remaining three as land.
What next? This is at it's very early stages - it's not particularly efficient and could do with some more optimisation of
the data structures so it's easier to find neighbours. It would also be nice to come up with a different method for
creating continents, something more akin to what actually happends - such as with continental drift. After that I
could look at introducing weather and climate effects, both of these will affect how the planet will look.
UEA Navigation App
This was a team project, in which I worked with a fellow student at UEA. For this we were given the challange to come up
with an idea for an application. We came up with a navigation application in which the user would select where they
wished to go and the application would calculate the shortest route. I programmed the iPhone app, and my partner
coded a parter application for the PC.
Journal Application
JRNL is a journal application for the iPad. I've always been interested in recording a journal, my first proper attempt to
do one was on my trip to Japan and it was something I really enjoyed doing. When I got back I continued to write
a paper journal but wanted to be able to search entries, include pictures etc - so that's when I decided to create
an iPad app. The app uses Core Data to store entries and settings and also allows users to export their whole journal
as HTML or XML. I'm currently working on PDF output and a few other features. Click the image above for further images.
Tidal Prediction
I developed this application for use at work to assist us in planning how much time is available to work at a certain location
below a certain tide level. Previous to this program it would take days to work through pages of tidal data, this
now takes seconds.
Originally this used data supplied from a tidal prediction program, it has now been updated to predict tides on its own,
from first principles.
Procedural Island Generation
Submarine Simulation
I made this in my third year at Uni, and the aim was to create a piece of software which would allow users to navigate through
an ocean scene populated with enemy boats. The software allowed users to torpedo enemy ships using a radar and targeting
system. Particle systems were used for emergency flares, and octrees were used for spatial partitioning. Click the
image above for further images.
Other Projects
A lot of my other projects have revolved around university work, these programs involving subjects such as a submarine simulation,
boat game, top down rpg and most recently working on a project in which the Microsoft Xbox Kinect system will be
used to teach people martial arts. Image above is a loading screen taking from Sine City - A university project in
which I did all of the 3d modelling, the collision detection and the weapons system. Click the image above for further
images.
// Craft
Papercraft
I quite often make my own Christmas or birthday cards. This year I decided to do something different and make a full-on 3D
Christmas 'card' (not a popup).
I wanted a 3D Christmas scene; so I started by producing a terrain model. I work for a construction company so I come across
drawings with terrain contours all the time. I started by drawing out a rough set of contours in AutoCAD on my iPad;
ensuring there were enough flat areas for me to put in my Christmas trees.
I printed out these contour templates and used them as a guide when cutting coloured cardboard. Next step was to create the
elevation some how, at the moment all the contours fitted together but were flat with the pieces joined together
like a puzzle, I needed to elevate each of these pieces.
To elevate each of the surfaces I cut small strips of card with some tabs and double sided sticky tape and joined these to
the surfaces. Finally to finish I cut out four sides to match the terrain contours and stuck these on.
For the Christmas element I created a couple of origami Christmas trees!
Next steps? I'd quite like to model Hogwarts, or at least a part of it - probably the viaduct to begin with. This is a little
challenging as there aren't a huge amount of actual set drawings; and the fact it changes between films, but I can
make a reasonable approximation. I've produced some sketches in AutoCAD and produced a paper model, the next thing
will be to improve the design a little before producing the viaduct (or at least a section of it) in card.